We are all familiar with the classic family genogram (see Figure 1). Using circles, squares, and various sorts of lines, one can use a genogram to map a family tree, showing the various generations of a family as well as marriages and divorces, adoptions, etc.
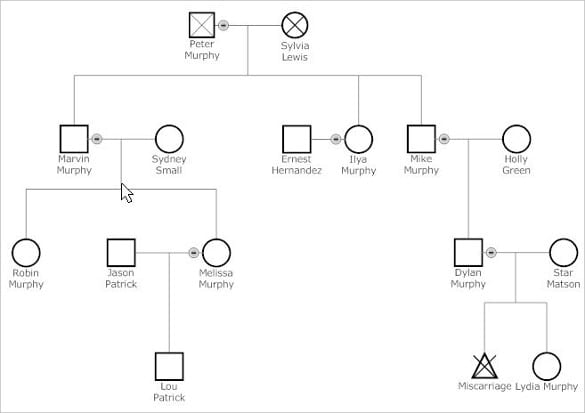
Figure 1
In this post I want to introduce a powerful online tool called Kumu as a way to create dynamic, interactive, family enterprise system maps.
Kumu is an incredibly powerful online tool. It is free (so long as your map is public) or charges a fee (if you want your map to remain private and accessible only to those to whom you grant permission.) I won’t go into all the details of what Kumu can do. If you explore their web site, you will find various examples of systems, concept, and relationship maps that tap the power of Kumu.
Here I want to demonstrate how Kumu can be used to create a dynamic family enterprise system map.
Kumu allows you to create elements and connections. An element is an object, represented on the map by a circle. It could be a person, an organization, a concept–really, anything you desire. A connection is a relationship between two or more elements, represented on the map by a line. It could be a family relationship, an employee relationship, a Board position, a trustee-beneficiary relationship–really, again, anything you desire. In Kumu, you can customize everything. So you can define all sorts of element “types” or connection “types.” Your imagination is your only limit.
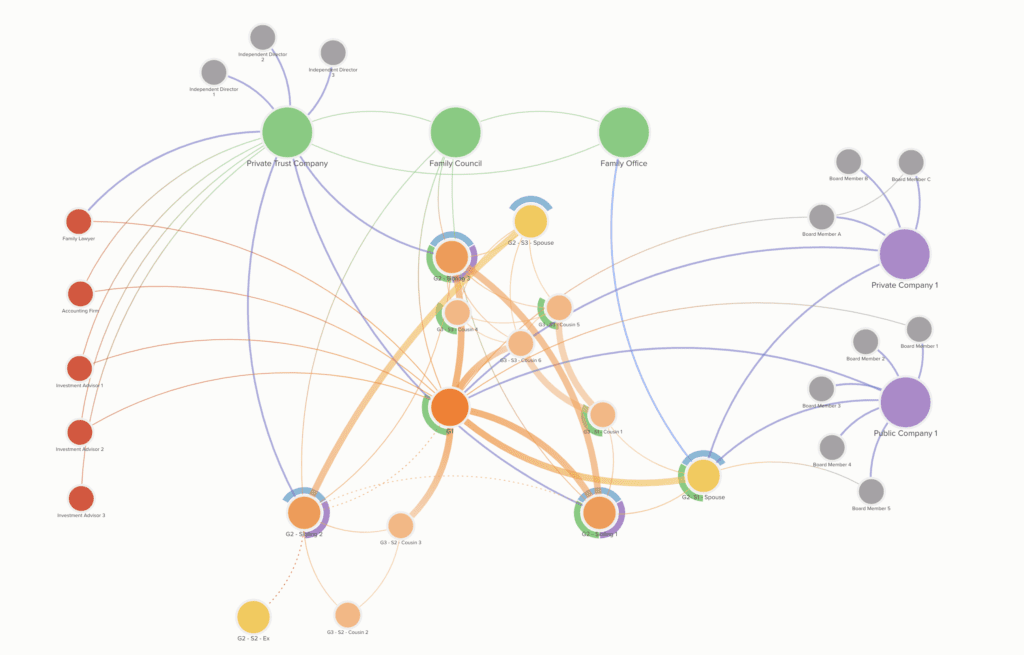
Figure 2
Figure 2 shows a sample family enterprise system map that I created for demonstration purposes. It is not about a particular family–it is generic. In the map, I have set rules in Kumu so that the map automatically colors, sizes, and otherwise decorates certain elements in certain ways and certain connections in certain ways. For example, family members are all a shade of orange, with G1 the darkest, G2 slightly less dark, and G3 the lightest. (Spouses are yellow.) Family organizations (e.g., the trust company, family council, and family office) are green. The family’s two major investments (Private Company 1 and Public Company 1) are purple. And service providers (e.g., the family lawyer, investment advisors, etc.) are red.
Using Kumu is incredibly easy and intuitive. With very little learning time, you can be creating very rich and informative system maps.
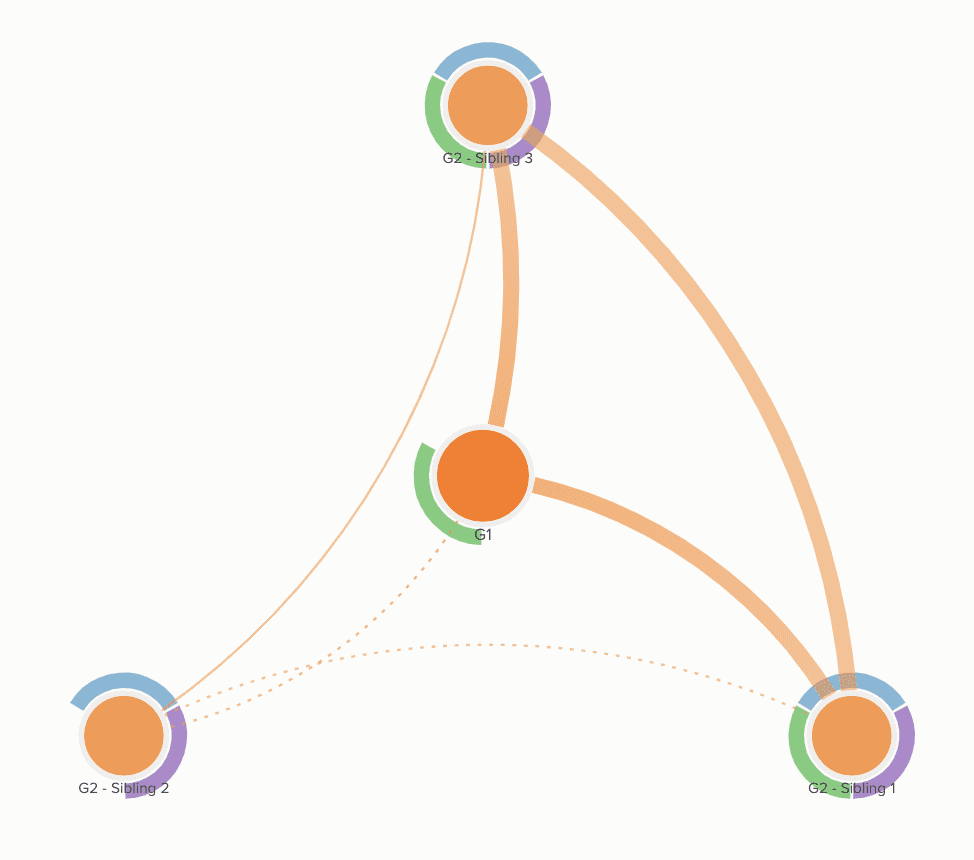
Figure 3
Let’s look at some basic elements and connections in this map. In Figure 3, I have had Kumu zoom in on the G1 and G2 family members. (Note that I have just labelled everyone “G1” or “G2 – Sibling 1,” but you would normally put their names, etc. This is just a generic example.)
What can we learn? I have added a field in Kumu for “strength of relationship.” Strong relationships are shown as wider lines. Weak relationships are shown as dotted lines. Instantly you can see that “Sibling 2” does not have particularly strong relationships within the family. Her relationship with her father (G1) is weak, as is her relationship with her brother (Sibling 1). Siblings 1 and 3, however, both have strong relationships with their father and with each other.
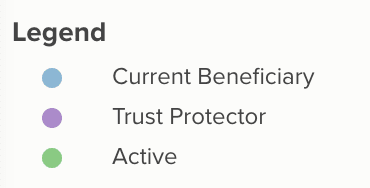
In addition, I have added flags to certain elements in this map. The flags are the semi-circles shown around some of the elements. I have added three flags: current beneficiary, trust protector, and “active” family member (meaning that the person participates in family events, family office meetings, etc.). (You could create any flags you want.) Again, by looking at this section of the map (in Figure 3) showing G1 and G2, you can see that the three siblings are current beneficiaries of the family’s trusts, as well as all being trust protectors of the ownership trusts that own the family’s private trust company. Sibling 2, however, is not “active.” Again, Sibling 2 seems somewhat disconnected from the rest of the family.
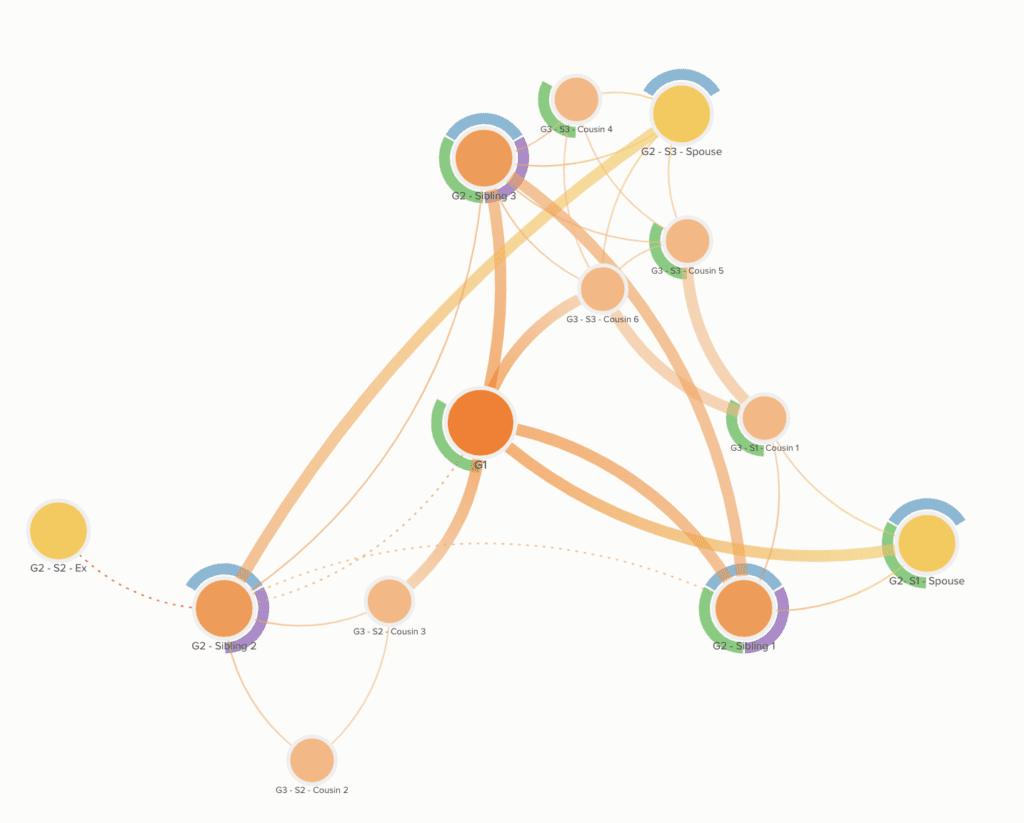
Figure 4
Figure 4 has zoomed out to show all family members–G1, G2, G3, and spouses. Spouses are coded as yellow on the map. This gets more complicated visually, but in Kumu it is easy to explore, isolate various elements or types of connections, and thereby learn from the map. But even with just this snapshot, you can see several things immediately:
- Sibling 1’s spouse is both active and has a strong relationship with G1. The other two spouses are not active.
- Spouses are current beneficiaries, so long as still married. Sibling 2’s spouse is divorced–indicated by a red connection. The relationship there is also weak–indicated by the red line being dashed. (All dashed lines are weak relationships on this map.)
- Sibling 2 has few strong relationships with anyone else in the family. There is one exception, however: Sibling 2 has a strong relationship with the spouse of Sibling 3. This is a potentially important connection.
- G1 has some strong relationships with certain grandchildren in G3. Including, interestingly, a strong relationship with Cousin 3–one of Sibling 2’s children. This is, again, a potentially important connection.
- It is clear that Sibling 1 and Sibling 2’s families are more connected at the sibling (G2) and cousin (G3) levels than either is connected to Sibling 2’s family.
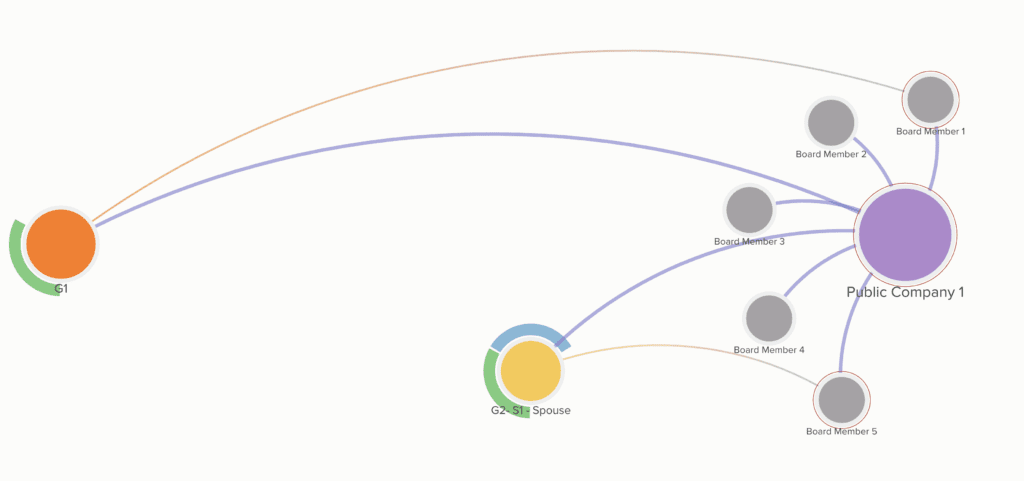
Figure 5
Now let’s look at some of the organizations or entities displayed on the map. This is where I use Kumu to really break away from a typical genogram. A family enterprise system map can contain organizations, trusts, family foundations, advisors, service providers, lenders, etc. There is no limit to how complex such a map can become.
Figure 5 focuses on Public Company 1. This is a company that the G1 wealth creator founded and ultimately took public. He is still the Chairman of the Board. I have told Kumu to color Board seats as purple lines. Interestingly, the spouse of Sibling 1 is also on the Board of Public Company 1. (She is also on the Board of Private Company 1, as well as an employee of the Family Office. More on that below.) Then you can also see other Board members, indicated by gray circles. And the map shows certain friendships: between G1 and Board Member 1, and between the spouse of Sibling 1 and Board Member 5. These informal relationships–friendships, etc.–can be very important if you want to understand the governance and power dynamics in a family enterprise system.
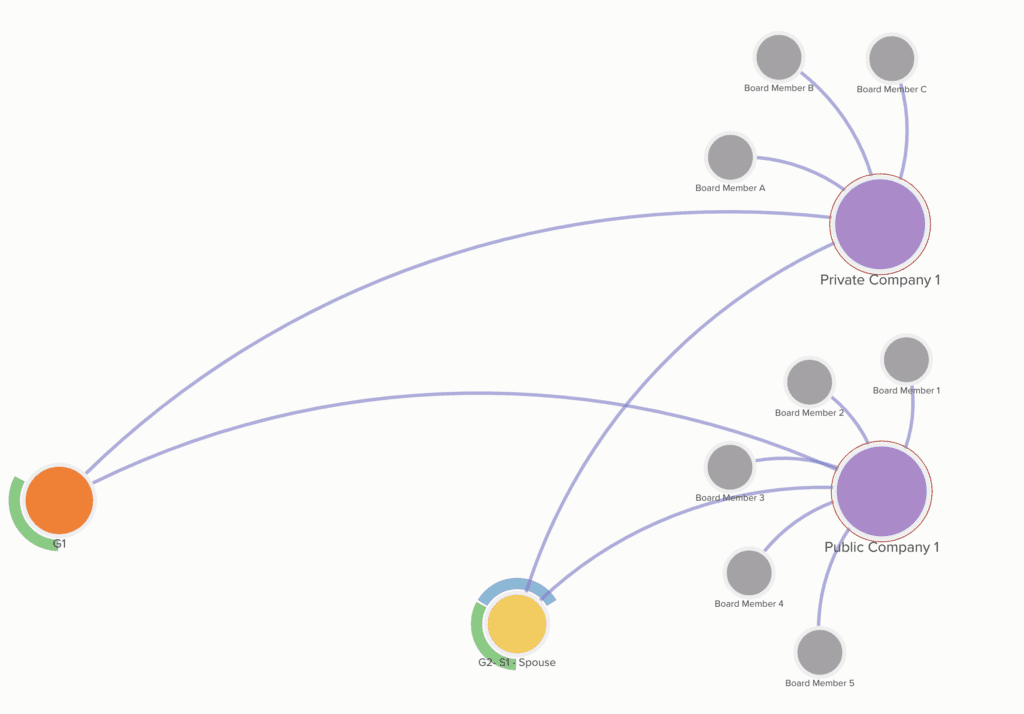
Figure 6
Figure 6 shows the Board members of both Public Company 1, which we looked at in Figure 5, and Private Company 1. This is a closely-held company that the family still operates and owns. Again, we see the G1 founder on the Board, but also the spouse of Sibling 1. She is on the Boards of both companies. Interestingly, there are no other family members on either Board.
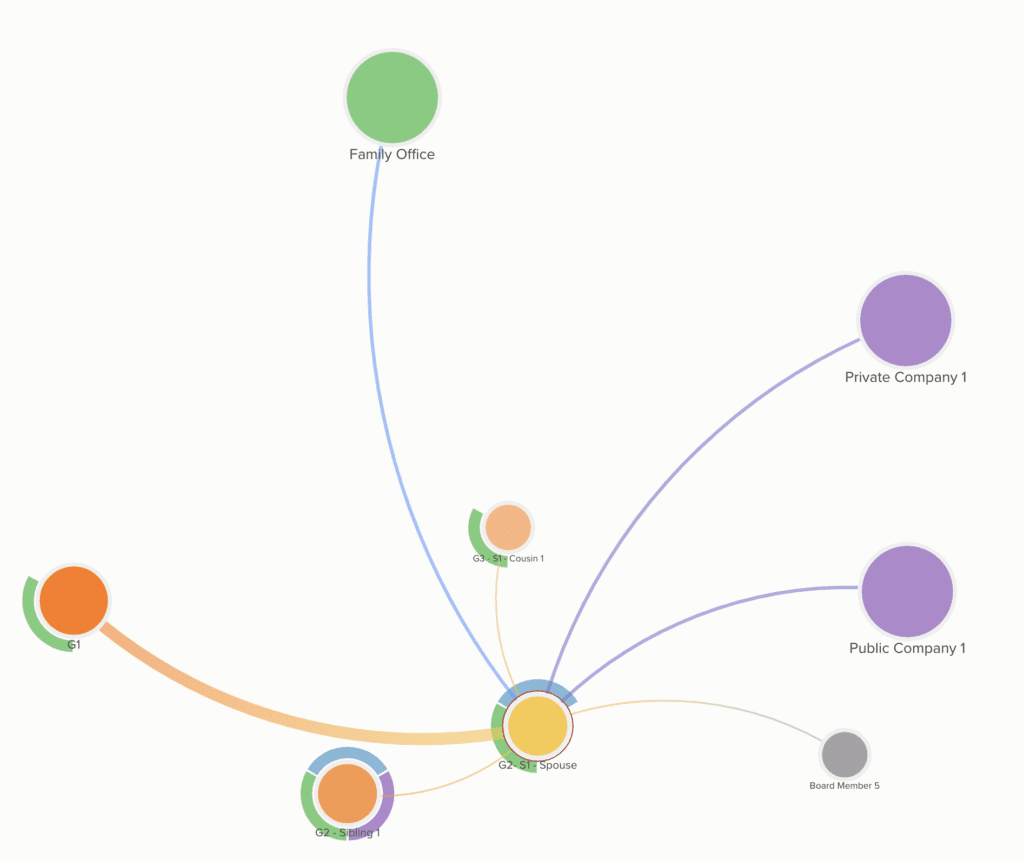
Figure 7
If you’ve read this far, you are probably curious about the spouse of Sibling 1. Who is she? Why is she so integrated into the family’s enterprise? Figure 7 focuses on this person, showing all of her connections. We see that she has a strong connection with G1, as we saw before. We see her connections by marriage and parenthood, but then also her Board connections to the two (purple) companies. Finally, we see that she is employed at the Family Office.
Figure 8 (below) shows the data fields that contain additional information about this person. Each element or connection in Kumu can have associated pictures, videos, text fields, and data fields. In Figure 8 you see the connection type: spouse. You also see the description field, with some text about this person. There is no photo uploaded, but you also see the three data fields I have set up in this demo: age, status (current beneficiary, trust protector, active), and strength (strong or weak) (for connections). You can add as many fields as you like in Kumu, and of all different types: text, numbers, dates, etc. Because you can then tell Kumu to behave differently depending on the content of those fields (e.g., coloring, sizing, etc., elements differently, adding flags, changing how connections are displayed, etc.), this makes Kumu both powerful and incredibly malleable to your needs.
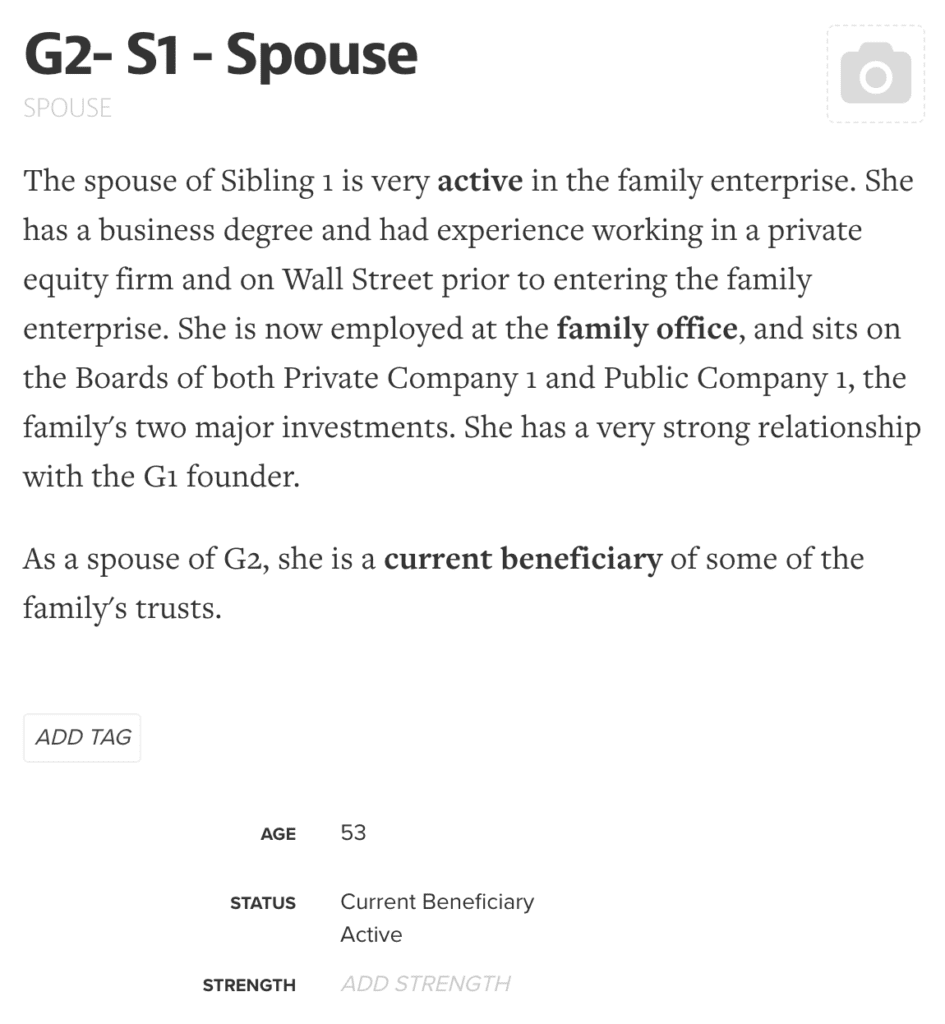
Figure 8
You can add as much detail to the fields for your project as you like, creating a true relational database.
Obviously a map such as this one–or the more detailed one you may have at this point imagined in your head–is only useful to the extent that it identifies issues that deserve attention. I have found that Kumo’s maps do that. I have learned a lot in the process of creating a family enterprise system map, in the experience of sharing it and discussing it with others, and in the process of reviewing it carefully to see what I could learn. Mapping in this way makes me ask questions: How strong is this or that relationship? What dimensions and data fields are important to include in the map? How far out into the periphery of the system do I want to go? These questions have been illuminating on their own.
One last thing. I haven’t shown here any of Kumu’s analytic abilities: it can run social network analysis on a map you create and show you various metrics (such as degree, closeness, or betweenness) that measure how influential different people (or elements) in your map are. You can then dynamically size elements, for example, by degree, which measures the number of connections a given elements has to other connections. As the map expands, Kumu dynamically re-sizes as degree changes. These features are amazing, and, again, often thought-provoking.
 Two final enticements to encourage you to try Kumu. First, instead of colored circles, elements can instead contain photos. Mine, for example, looks like this. For a family system map, this can really make the diagram come alive.
As a final encouragement to explore using Kumu for mapping a family enterprise system, you can play with the map we have looked at here. I suggest looking at the (red) service providers. Who do they have relationships with? Or explore the Board of the Private Trust Company. It’s all fair game.
You can explore this demo Kumu map in a full-fledged window on its own by clicking here.
Or play with it in the embedded Kumu map, below. Here are some simple tips:
- If you hover your mouse (or finger, if on a tablet) over a particular element, Kumu will showcase that element and its connections by dimming all ohers.
- If you click an element, you will focus on it. Click the small circle icon that appears (on the upper right) to un-focus.
- Click any of the labels at bottom-center (e.g., G1, G2, etc.) and Kumu will highlight those items. Try clicking G1, G2, and Service Providers. This will quickly show you which family members have relationships with the various service providers serving their enterprise.
Enjoy.